In software-defined radio (SDR), the most discouraging part is often not the algorithm, but everything that comes before it: installing drivers, entering commands, writing initialization code, and creating spectrum plots. By the time the environment is up and running, much of the enthusiasm for examining the signal has already been spent.
We have brought this entire process into a single interface: LUOWAVE SignalCapture,
software for SDR spectrum visualization and signal acquisition. Developed using Luowave’s in-house Luowave Driver, it supports the entire LW39x0 series of software-defined radio devices and provides a unified graphical environment for device control, RF signal acquisition, and real-time analysis. The software communicates with the hardware through a PCIe interface. Once connected, it automatically identifies the device model and applies the corresponding channel configuration.
The platform supports simultaneous observation of up to 8 channels, a maximum single-channel observation bandwidth of 200 MHz, and RF coverage from 75 MHz to 6 GHz. Coverage can be extended to higher frequency bands using a millimeter-wave frequency-conversion module.
🎬 Hands-on Demonstration Video

LUOWAVE SignalCapture Main Interface
A Complete Workflow: From Device Connection to IQ Recording
In conventional workflows, this process is assembled from several disconnected tools. LUOWAVE SignalCapture integrates these steps into a single workflow:
Connect the Device
Select the device and establish a PCIe connection. The software identifies the model and available receive channels.
Configure Parameters
Set the center frequency, sampling rate, receive gain, and channel combination. Channels can be selected individually to match the actual input connections.
Calibrate as Needed
When hardware RF Cal is enabled, calibration is completed automatically before acquisition begins.
Acquire and Analyze
The software parses and separates the IQ data from each channel in real time, performs FFT calculations, and simultaneously displays the spectrum, waterfall, and time-domain waveforms.
Store and Reprocess
Save raw IQ data as BIN files for subsequent offline processing in MATLAB or Python.
Overlaid Multichannel Spectra: Direct Signal Comparison
The value of a multichannel device lies not only in the number of channels, but also in the ability to examine the signals on all channels clearly and simultaneously.
The software receives multichannel IQ data in real time, separates the channels, and overlays their spectra as differently colored traces on the same axes. Users can select which channels to observe, while the legend identifies the channel associated with each trace.
This allows users to compare, within a single plot, whether a signal is present on each channel, whether gains are consistent, and how signals differ between antenna inputs, without exporting data and writing additional scripts. For tasks such as multichannel receive-chain verification and comparative monitoring of multiple signals, this is substantially more efficient than switching between channels individually.
Multiple channels operating at high sampling rates also generate substantial data volumes. The software subsamples the data used for plotting and optimizes the display refresh process, reducing the display workload while maintaining real-time observation.
Channel Count and Observation Bandwidth: Balancing Requirements
There is a defined relationship between the number of active channels and the available observation bandwidth.
For an 8-channel model, for example, enabling all eight channels uses a sampling rate of 61.44 MHz, allowing users to quickly confirm signal input on each channel. Restricting the channel combination to the paths that actually carry signals, such as A1/A2, allows the sampling rate to increase accordingly, expanding the observation bandwidth from tens of megahertz to nearly 100 MHz.
This trade-off can be managed through two options in the acquisition configuration panel, without modifying or recompiling code. For tests that require repeated switching between observation modes, this eliminates the time otherwise spent on a full recompilation and restart.
Spectrum Analyzer–Grade Measurements: Beyond Trace Visualization
Viewing the shape of a trace alone does not constitute a measurement. The software calculates spectra from raw IQ data in real time and integrates commonly used spectrum analyzer functions into the same view:
Up to Four Markers
Each Marker can track a real-time, Max Hold, or Min Hold spectrum trace. Markers can be dragged directly on the plot and display the frequency and power at the selected position in real time.
Spectrum Averaging
An adjustable averaging coefficient smooths the data, helping users distinguish weak signals from noise.
Max Hold / Min Hold
These functions retain the spectral extrema observed over time, showing the range of signal amplitude variations. They are useful for examining sporadic signals and intermittent interference.
Spectrum Range Adjustment
Focus on a selected frequency band to examine details more closely.
Used together, these functions allow routine spectrum measurements and anomalous-signal verification to be performed largely within the software, without additional external instruments.
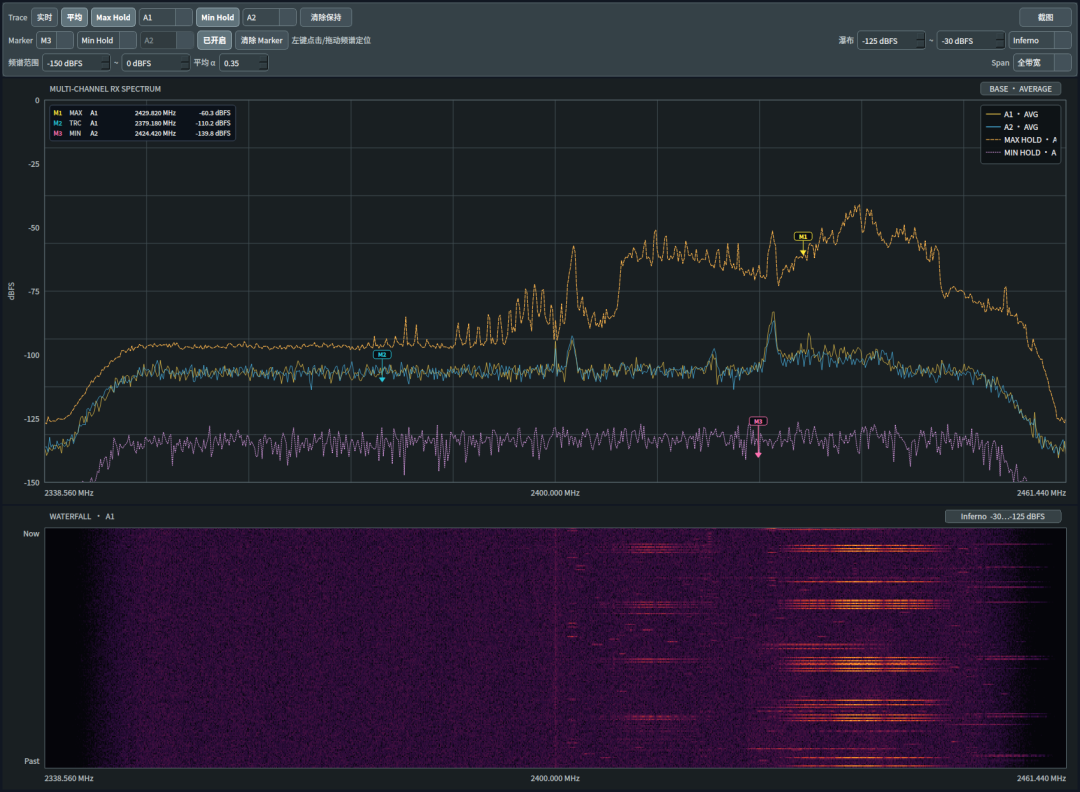
Detailed Spectrum View with Multiple Markers
Three Views: Spectrum, Waterfall, and Time-Domain Waveforms
A spectrum alone shows which frequency components are present. Determining when a signal appears and how its envelope changes requires additional perspectives.
Spectrum
Shows the relationship between frequency and power at the current instant, helping users assess the frequency band occupied by a signal, its strength, and its signal-to-noise ratio.
Waterfall
Displays successive spectra over time. Transient signals, including frequency-hopping signals, bursts, and intermittent interference, produce trackable trajectories over time. Four display styles are available, with adjustable noise-floor level, display range, and contrast.
Time-Domain Waveforms
Directly displays the time-domain waveforms of the IQ data for examining modulation envelopes, signal onset, and abrupt amplitude changes.
Cross-referencing these views provides frequency-domain, time-frequency, and time-domain evidence. An anomalous signal can usually be investigated without switching tools.
Hardware Calibration: Making Multichannel Data Comparable
Inherent differences between channels can sometimes be comparable in magnitude to the signal being measured.
The software can invoke the device’s built-in RF Cal calibration function. When enabled, calibration runs automatically before each acquisition, completing after the device’s warm-up phase. The calibration status is displayed on the panel. This function improves signal amplitude accuracy and interchannel consistency, providing a basis for multichannel signal comparison and synchronous acquisition.
IQ Recording, Screenshots, and Runtime Monitoring
Field work often leaves little time for detailed computation. Observation and processing can be performed separately.
Acquired raw IQ data can be saved as BIN files. Both continuous and timed acquisition are supported, with configurable file names, output directories, and acquisition durations. To accommodate the disk-write demands of multichannel acquisition at high sampling rates, the software provides disk-write mode and IQ buffer duration settings. An appropriate disk-write mode can be selected when more channels are active, while buffering accommodates transient write demands at higher sampling rates. In most cases, “Auto” is sufficient. Sustained acquisition capability is jointly constrained by the device data interface, host performance, and storage-device write speed. Configurations involving eight channels and a sampling rate of 245.76 MHz still require trade-offs based on the actual system configuration.
Saved data supports offline playback and can be processed in MATLAB or Python for signal processing and algorithm validation: observe trends online, then perform detailed calculations offline.
For documentation, users can pause the display and capture a screenshot directly, selecting the destination directory, including the desktop. The resulting image includes the current view—spectrum, waterfall, or time-domain waveforms—together with the legend and Marker readings, and can be used directly in test records and reports.
The interface also displays device connection status, data reception status, and acquisition task status, while recording runtime logs. If data loss or acquisition errors occur, enabling developer mode produces more detailed information to help determine whether the issue originates from disk read/write speed, interface bandwidth, or software configuration.
| Module | Key Functions |
|---|---|
| Device Management | PCIe device connection, automatic model identification, and channel configuration matching |
| RF Configuration | Center frequency, sampling rate, receive gain, and channel selection |
| Data Acquisition | IQ data reception, continuous acquisition, parallel multichannel acquisition, and automatic pre-acquisition calibration |
| Data Processing | Multichannel data separation and FFT spectrum calculation |
| Real-Time Display | Spectrum, waterfall, time-domain waveforms, and multichannel overlays on a single display |
| Spectrum Analyzer Functions | Averaging coefficient, spectrum range, Max Hold / Min Hold, up to four Markers, and screenshots |
| Data Storage | Raw IQ recording to disk (BIN), manually controlled continuous acquisition and timed acquisition, disk-write mode, and buffer duration |
| Runtime Monitoring | Device status, acquisition status, runtime logs, and developer mode |
Software Feature Overview
Typical Applications
Multichannel Receive-Chain Verification
Observe the spectral performance of multiple receive channels simultaneously and compare signal amplitudes and spectral differences between channels.
Wideband RF Signal Observation
Use the single-channel wideband acquisition capability for real-time observation and data capture within a target frequency band.
Comparative Monitoring of Multiple Signals
Use overlaid multichannel spectra to observe changes across different receive chains or antenna inputs.
Raw Signal Acquisition and Algorithm Validation
Save raw IQ data for offline analysis and algorithm validation in MATLAB or Python.
Synchronous Acquisition and Consistency Analysis
Use the built-in hardware calibration to support acquisition tasks requiring interchannel consistency.
Conclusion
This software packages the low-level device control, high-speed data acquisition, and real-time analysis capabilities of Luowave Driver into an SDR host application that users can operate directly: connect the device → configure parameters → calibrate as needed → acquire and analyze multiple channels in real time → perform spectrum analyzer–grade measurements → view signals in multiple representations → record raw IQ data to disk and reprocess it offline. The entire workflow can be completed without writing a single line of code. Interfaces are also in place for future expansion with additional signal processing and application functions.
The previous article introduced LUOWAVE SignalForge, the transmission tool built on the same platform. One tool handles transmission and the other reception. Together, they enable closed-loop verification, from signal generation to reception and analysis, using a single hardware system.
The software suite is developed using Luowave’s in-house Luowave Driver and SDK and is closely integrated with its in-house SDR hardware to fully utilize multichannel synchronization and high-speed acquisition capabilities. Continued development will further strengthen the domestically developed SDR software ecosystem in China.
To learn more about the LW39x0 series, obtain the software, or schedule a demonstration, please contact the Luowave Electronics technical team.
Contact Luowave Electronics